In May, 2016, we have rolled out a new package of ticket reports and analytical charts to our cloud solutions.
As a result, our ticket helpdesk customers can make use of new additional reports to analyse their ticket operations.
Here below is a list of the available reports.
Ticket Reports
This category of reports focus on different perspectives of tickets. By looking at the ticket status, priority, ticket department, help topic, ticket source, SLA (service level agreement), and also processing time, these reports will therefore give a summary view and detailed view of the ticket distributions and ticket processing.
1 – Ticket Summary (General)
2 – Ticket Summary – by Ticket Status
3 – Ticket Summary – by Department
4 – Ticket Summary – by Priority
5 – Ticket Summary – by Topic
6 – Ticket Summary – by Source
7 – Ticket Summary – by User Email
8 – Ticket Summary – by SLA
9 – Ticket – Processing Time by Department (Closed Tickets)
10 – Ticket – Processing Time by Department (Open Tickets)
11 – Ticket – Processing Time by Topic (Closed Tickets)
12 – Ticket – Processing Time by Topic (Open Tickets)
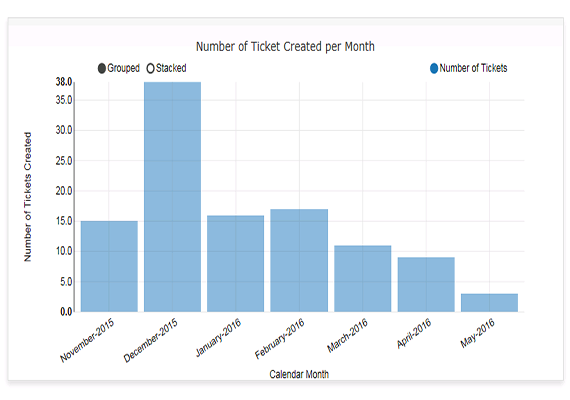
13 – Ticket Creation Count – by Month
14 – Ticket Count – by Department & Ticket Status (Summary)
15 – Topic Count – by Department & Ticket Status
Analytical Charts
This category of reports illustrates the real-time statistics in the form of charts, making visualisation and understanding much easier and intuitive.
16 – Ticket Creation Count – by Month (Bar Chart)
17 – Ticket Count – by Department & Ticket Status (Bar Chart)
18 – Ticket Count – by Department & Ticket Status (Pie Chart)
19 – Ticket Topic Count (Bar Chart)
20 – Ticket Topic Count (Pie Chart)
21 – Ticket Source Count (Bar Chart)
22 – Ticket Source Count (Pie Chart)
23 – Ticket Priority Count (Bar Chart)
24 – Ticket Priority Count (Pie Chart)
Listing Reports
This category of reports simply list down according to the ticket helpdesk system setups.
25 – Listing – Ticket Topics
26 – Listing – Timezone
27 – Listing – FAQ or KnowledgeBase
28 – Listing – SLA
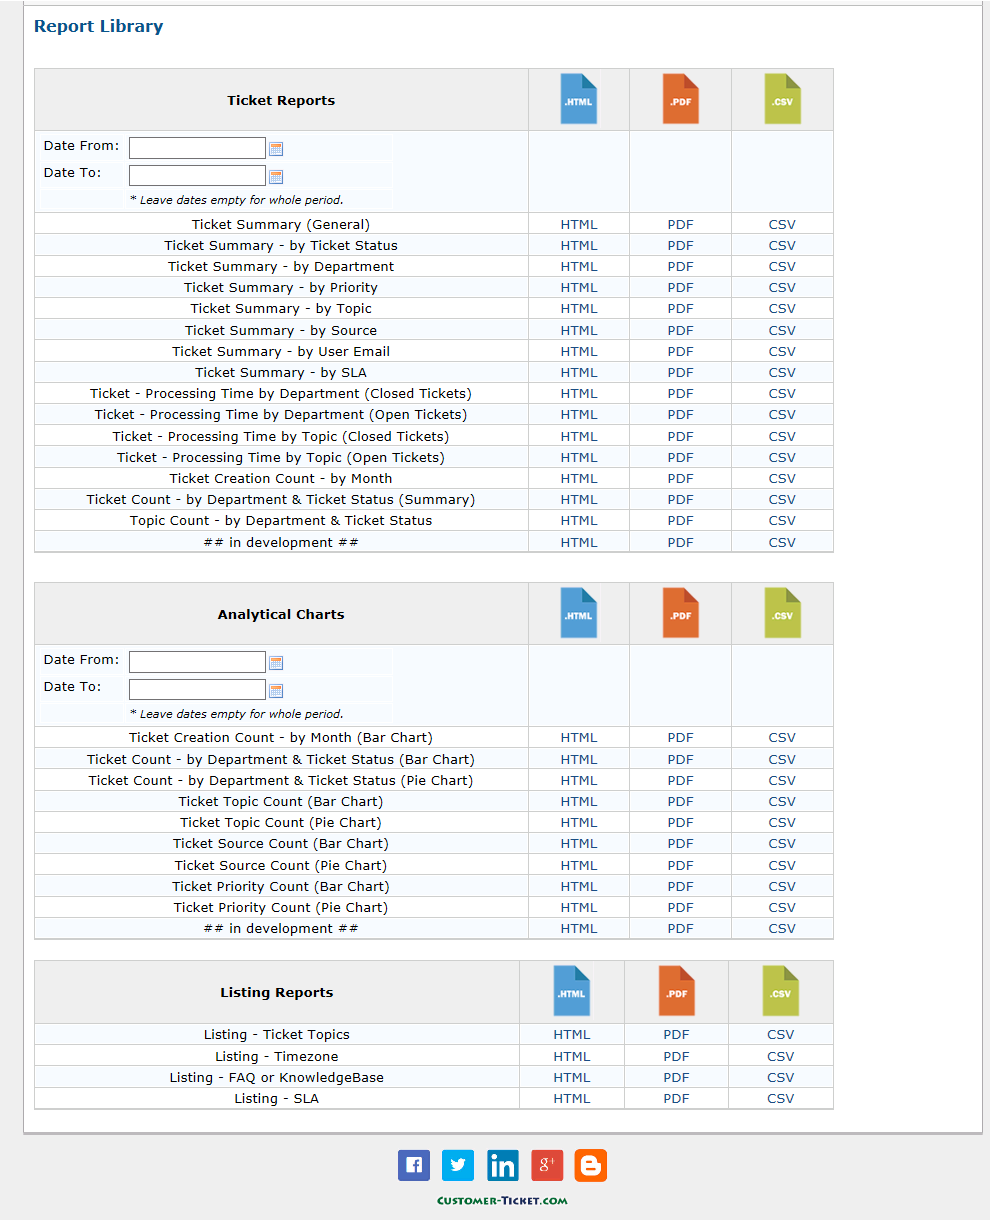
In total, we have 3 formats of reports available. They are HTML web report, PDF file, CSV file for spreadsheet.
To see our analytic charts and management reports in action, please log on to our Free Trial Demo with the below trial account access.
Username: demo
Password: demo